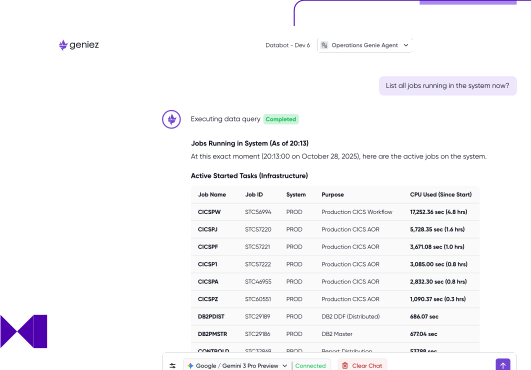
Create dashboards and reports on system activity, trends and projections.


Improve availability

Reduce mean time to resolution

Reduce cost

Enable proactive response

Intuitive visibility
Most monitoring landscapes are a patchwork: a tool for this metric, a separate stack for that alert, each one only useful for a narrow slice of the picture. Geniez Monitoring uses native mainframe operational data to simplify all of that into a single, streamlined approach. With no prerequisites or new infrastructure to stand up, implementation is straightforward.
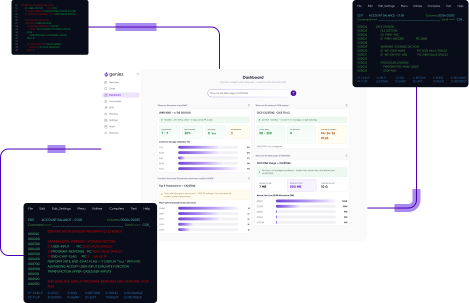

Ask in plain language and drill straight into the specifics that matter to you. Rather than hunting through menus or pre-built reports, you get direct control over what you see surfacing exactly the detail you need.
Build a dashboard that works the way you do. A flexible approach means the view adapts to your priorities.


When you need to demonstrate transparency or trace back through what happened, a simple export capability makes monitoring data ready for audit at a moment's notice.

Monitor your entire z/OS stack from one place, using native mainframe operational data.
Ask in plain language and go straight to the specifics that matter to you.
Build a view around your own priorities.
Replace a patchwork of niche point tools with a single streamlined approach.
Export monitoring data on demand for transparency and traceability.
Let AI handle routine monitoring and automation on your terms.





Most monitoring landscapes are a patchwork of tools, each useful only for a narrow slice of the picture. Geniez consolidates that into a single, streamlined approach, so you're not stitching together multiple stacks to get one view.
It's designed to improve availability and reduce mean time to resolution, helping teams identify and respond to issues faster and proactively, before they escalate.
You ask in natural language. Rather than navigating menus or template reports, you drill straight into the specifics you're interested in and get exactly the detail you need.